Since PAN-OS version 9.0 you can configure GRE tunnels on a Palo Alto Networks firewall. Greetings from the clouds. As always, this is done solely through the GUI while you can use some CLI commands to test the tunnel. This time Palo put a little stumbling block in there as you have to allow a GRE connection with a certain zone/IP reference. I will show how to set up such a GRE tunnel between a Palo and a Cisco router. Here we go:
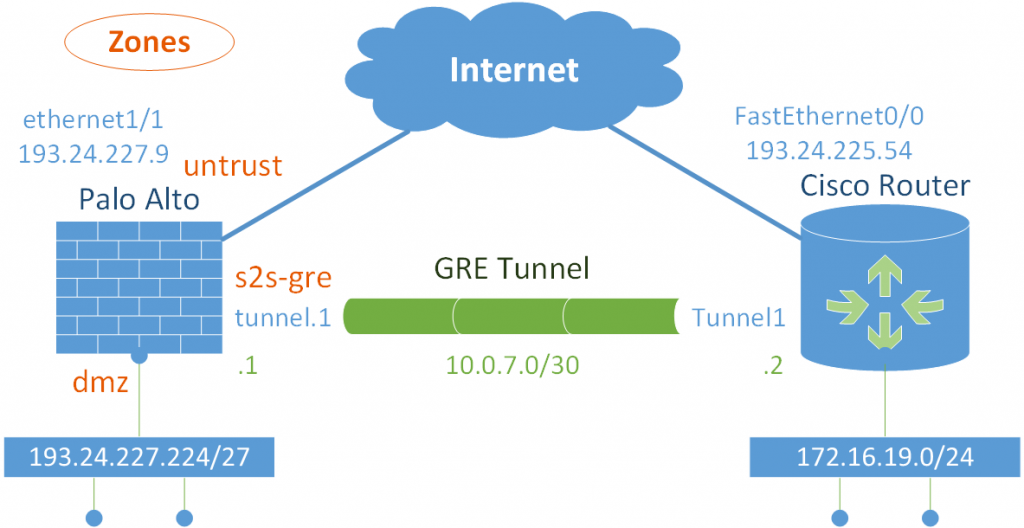
I am using a PA-220 with PAN-OS 9.1.3. This is my addressing scheme:
GRE on the Palo
Configuring a GRE tunnel involves the following steps (refer to the official PAN documentation: GRE Tunnel Overview):
- tunnel interface with IP address
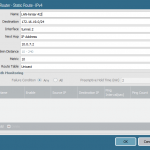
- GRE tunnel itself
- static route (or routing protocol) to the remote network
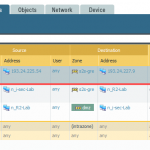
- security policies allowing the internal-to-remote traffic and vice versa
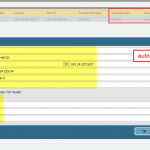
- AND: a security policy allowing the incoming GRE tunnel! <- this one is really special as it is from source zone “untrust” with the public IP address of the remote GRE tunnel endpoint to destination zone from the tunnel interface (in my case its called “s2s-gre”) but with the public IP address of the Palo (which resides on the “untrust” zone). RTFM: “Likewise, if the zone of the tunnel interface associated with the GRE tunnel (for example, tunnel.1) is a different zone from that of the ingress interface, you must configure a Security policy rule to allow the GRE traffic.”
Here are some screenshots of my setup:
GRE at Cisco Router
On a Cisco router, the appropriate configuration looks as follows. No security policies here – everything is allowed because it’s a router. The keepalive settings are the defaults. Using only the configuration command
keepalivedefaults to
keepalive 10 3, which are the same values as on the Palo. (It’s rather likely that PAN took the defaults from Cisco. ;))
interface Tunnel1
 ip address 10.0.7.2 255.255.255.252
 keepalive 10 3
 tunnel source FastEthernet0/0
 tunnel destination 193.24.227.9
!
ip route 193.24.227.224 255.255.255.224 Tunnel1 10.0.7.1
Stats ‘n Troubleshooting
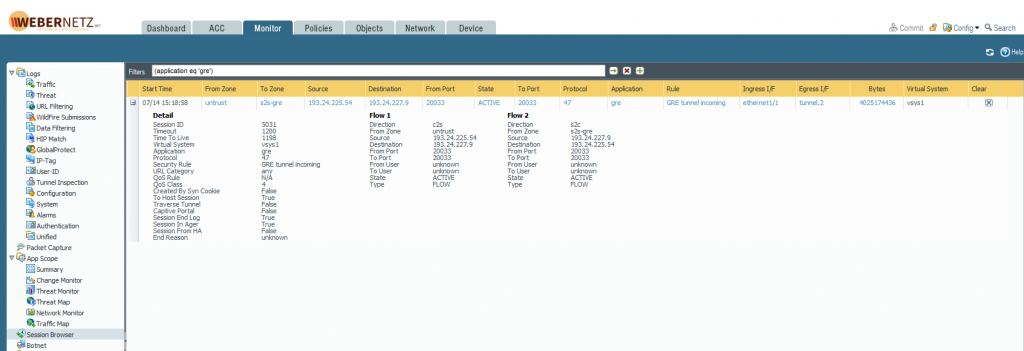
Keep in mind that GRE is *not* a TCP/UDP protocol, but an own IP protocol with number 47. If you have some intermediary firewalls you have to allow this IP protocol. Likewise, the GRE session on the Palo is listed with proto = 47.
Palo Alto
This screenshot shows the traffic log BEFORE I allowed the GRE policy. Of course, they are allowed now. The application is “gre” and the IP protocol is “gre” as well:
GRE sessions are normally quite long-living in the session browser:
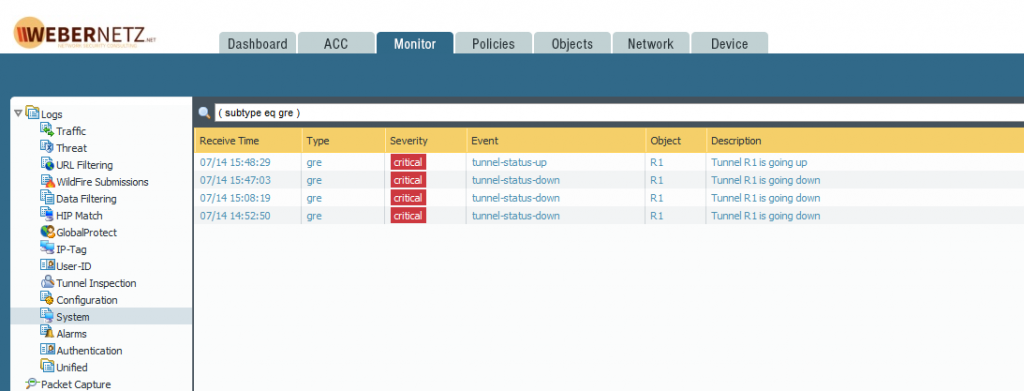
The system log, filtered for “subtype eq gre”, shows the tunnel status. For whatever reason I have some more downs than ups:
From the CLI you can ping the other end of the tunnel, sourcing from the own tunnel interface:
weberjoh@pa> ping source 10.0.7.1 host 10.0.7.2
PING 10.0.7.2 (10.0.7.2) from 10.0.7.1 : 56(84) bytes of data.
64 bytes from 10.0.7.2: icmp_seq=1 ttl=255 time=2.91 ms
64 bytes from 10.0.7.2: icmp_seq=2 ttl=255 time=2.86 ms
64 bytes from 10.0.7.2: icmp_seq=3 ttl=255 time=2.70 ms
^C
--- 10.0.7.2 ping statistics ---
3 packets transmitted, 3 received, 0% packet loss, time 2018ms
rtt min/avg/max/mdev = 2.709/2.829/2.911/0.086 ms
And verify the tunnel interface status which shows the GRE stats of the keepalives as well as sent/received bytes/packets:
weberjoh@pa> show interface tunnel.2

--------------------------------------------------------------------------------
Name: tunnel.2, ID: 258
Operation mode: layer3
Virtual router default
Interface MTU 1500
Interface IP address: 10.0.7.1/30
Interface management profile: Ping
  ping: yes  telnet: no  ssh: no  http: no  https: no
  snmp: no  response-pages: no  userid-service: no
Service configured:
Zone: s2s-gre, virtual system: vsys1
Adjust TCP MSS: no
Policing: no
--------------------------------------------------------------------------------
GRE tunnel name:               R1
tunnel interface state:        Up
disabled:                      False
copy-tos:                      False
keep alive enabled:            True
local-ip:                      193.24.227.9
peer-ip:                       193.24.225.54
stats:
   ka-id:                      3847
   ka-send:                    3847
   ka-recv:                    3846
   ka-curr-retry:              0
   ka-last-timestamp:          1287801
   ka-recv-map:                0
   ka-owner:                   0
--------------------------------------------------------------------------------
Logical interface counters read from CPU:
--------------------------------------------------------------------------------
bytes received                           3942406917
bytes transmitted                        95892322
packets received                         2794777
packets transmitted                      1509634
receive errors                           0
packets dropped                          8
packets dropped by flow state check      0
forwarding errors                        0
no route                                 0
arp not found                            0
neighbor not found                       0
neighbor info pending                    0
mac not found                            0
packets routed to different zone         0
land attacks                             0
ping-of-death attacks                    0
teardrop attacks                         0
ip spoof attacks                         0
mac spoof attacks                        0
ICMP fragment                            0
layer2 encapsulated packets              0
layer2 decapsulated packets              0
tcp cps                                  0
udp cps                                  0
sctp cps                                 0
other cps                                0
--------------------------------------------------------------------------------
Cisco Router
Pinging the other tunnel interface:
R1#ping 10.0.7.1
Type escape sequence to abort.
Sending 5, 100-byte ICMP Echos to 10.0.7.1, timeout is 2 seconds:
!!!!!
Success rate is 100 percent (5/5), round-trip min/avg/max = 1/3/4 ms
Tunnel interface status:
R1#show interfaces Tunnel 1
Tunnel1 is up, line protocol is up
  Hardware is Tunnel
  Internet address is 10.0.7.2/30
  MTU 17916 bytes, BW 100 Kbit/sec, DLY 50000 usec,
     reliability 255/255, txload 255/255, rxload 20/255
  Encapsulation TUNNEL, loopback not set
  Keepalive set (10 sec), retries 3
  Tunnel source 193.24.225.54 (FastEthernet0/0), destination 193.24.227.9
   Tunnel Subblocks:
      src-track:
         Tunnel1 source tracking subblock associated with FastEthernet0/0
          Set of tunnels with source FastEthernet0/0, 1 member (includes iterators), on interface <OK>
  Tunnel protocol/transport GRE/IP
    Key disabled, sequencing disabled
    Checksumming of packets disabled
  Tunnel TTL 255, Fast tunneling enabled
  Tunnel transport MTU 1476 bytes
  Tunnel transmit bandwidth 8000 (kbps)
  Tunnel receive bandwidth 8000 (kbps)
  Last input 00:01:36, output 00:00:04, output hang never
  Last clearing of "show interface" counters never
  Input queue: 0/75/0/0 (size/max/drops/flushes); Total output drops: 0
  Queueing strategy: fifo
  Output queue: 0/0 (size/max)
  5 minute input rate 8000 bits/sec, 16 packets/sec
  5 minute output rate 177000 bits/sec, 30 packets/sec
     1513537 packets input, 96737817 bytes, 0 no buffer
     Received 0 broadcasts (0 IP multicasts)
     0 runts, 0 giants, 0 throttles
     0 input errors, 0 CRC, 0 frame, 0 overrun, 0 ignored, 0 abort
     2801599 packets output, 3978753521 bytes, 0 underruns
     0 output errors, 0 collisions, 0 interface resets
     0 unknown protocol drops
     0 output buffer failures, 0 output buffers swapped out
(Sorry for being legacy-IP-only this time…)
Photo by Sharosh Rajasekher on Unsplash.
